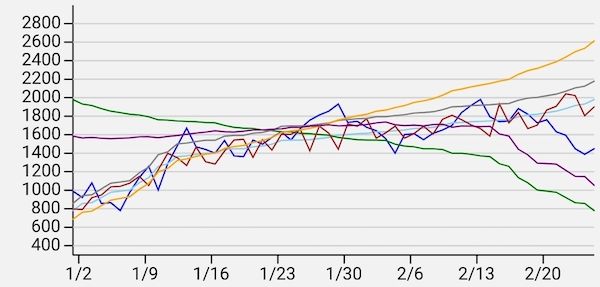
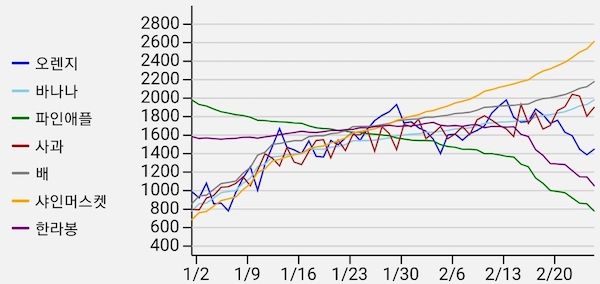
React Native 에서 차트 구현 - 3. 라인차트 레전드 기능
1. 개요
이전 글들에서는 라인차트의 기본 기능 및 옵션 기능을 구현해보았다.
오늘은 차트의 레전드(범례) 기능을 구현해보자.
2. 구현
레전드를 구현하는 방법은 두 가지가 있다.
- 하나는 차트와 동일하게 SVG + D3.js 조합을 사용하는 것.
- 다른 하나는 일반 컴포넌트를 사용하는 것.
(웹에서는<div />등의 엘리먼트들. React Native 환경에서는<View />,<Text />등)
웹에서라면 두 방법 모두 상황과 취향에 따라 선택하면 된다.
- 전자의 경우 D3.js 가 직접 DOM 을 제어할 수 있기 때문에 차트 구현과 레전드 구현을 일관되게 관리할 수 있다는 점과,
<svg />의viewBox속성을 통해 크기를 같이 관리할 수 있다는 점 등등의 장점이 있다. - 반면 후자는 flexbox 등의 CSS 를 사용해 쉽게 구현할 수 있다는 장점이 있다.
하지만 React Native 환경에서는 후자를 추천한다.
- 왜냐하면 전자의 경우 웹과 달리 D3.js 가 컴포넌트를 직접 그릴 수 없는 상황이어서 SVG 컴포넌트들에 좌표값을 일일이 넣어줘야 하는데 이게 생각보다 번거롭고, 레전드 내부의 요소들을 예쁘게 정렬하겠다며
onLayout()과 조합해 좌표를 여러 번 보정할 경우에는 성능이 정말 좋지 않다.
"웹에서는 비슷한 구현을 SVG + D3.js 로 해도 성능이 나쁘지 않았다." 라는 기억만 가지고 작업을 진행했다가 고생한 경험이 있다. - 반면 후자의 경우 flexbox 를 사용해 구현하면 쉽기도 하거니와 성능적으로 걱정할 필요가 없다.
따라서 이 글에서도 레전드는 <View /> 와 <Text /> 를 활용해서 구현한다.
2.1. 레전드 기본 기능 구현
레전드의 필수이자 기본 기능은 각 시리즈의 색상과 이름을 목록으로 표시해주는 것이다.
해당 기능을 구현해보자.
2.1.1. 각 시리즈의 이름과 색상 가져오기
일단 우리는 시리즈에 이름을 지정하지 않고 있다. 따라서 이름을 지정할 수 있도록 수정해줘야 한다. TimeSeries 타입을 수정하자.
export type TimeSeries = {
  name?: string;  color?: string;
  lineWidth?: number;
  data: TimeSeriesDatum[];
};그리고 색상이 필요하다.
색상은 시리즈에 직접 지정할 수도 있지만 linesOptions 로 지정할 수도 있고, 또한 <Lines /> 컴포넌트에서 기본값을 갖고 있기도 하다. (이전 글의 2.4. 항목 참고)
linesOptions 는 레전드 컴포넌트에 prop 으로 전달해주면 되겠고, <Lines /> 컴포넌트에서 사용 중인 기본값은 공통 상수로 만들어서 사용하면 될 것 같다. 기본값을 constants.ts 로 옮기자.
// ...
export const DEFAULT_COLORS = [
  "blue",
  "skyblue",
  "green",
  "brown",
  "gray",
  "orange",
  "purple",
  "red",
  "pink",
  "black",
];그리고 기존 <Lines /> 에서는 이 값을 가져가 사용하도록 수정하자.
// ...
import { DEFAULT_COLORS } from "../constants";
// ...2.1.2. <Legend /> 구현
이제 series와 linesOptions 를 prop 으로 받는 <Legend /> 컴포넌트를 구현해보자.
import { StyleSheet, View } from "react-native";
import Text from "components/Text";
import { LinesOptions, TimeSeries } from "../types";
import { DEFAULT_COLORS } from "../constants";

type LegendProps = {
  series: TimeSeries[];
  linesOptions?: LinesOptions;
};
function Legend({ series, linesOptions }: LegendProps) {
  const colors = linesOptions?.colors ?? DEFAULT_COLORS;
  return (
    <View style={styles.container}>
      {series.map((sr, i) => (
        <View key={i} style={styles.item}>
          {/* 시리즈의 색상을 네모 모양으로 표시한다. */}
          <View
            style={{
              ...styles.rect,
              backgroundColor: sr.color ?? colors[i % colors.length],
            }}
          />
          {/* 시리즈의 이름을 표시한다. 이름 값이 없으면 "시리즈 1" 형식으로 표시한다. */}
          <Text>{sr.name ?? `시리즈 ${i + 1}`}</Text>
        </View>
      ))}
    </View>
  );
}

const styles = StyleSheet.create({
  container: {
    flexDirection: "row",
    justifyContent: "center",
    flexWrap: "wrap",
  },
  item: {
    flexDirection: "row",
    alignItems: "center",
    marginLeft: 8,
    marginRight: 8,
  },
  space: {
    width: 16,
  },
  rect: {
    width: 12,
    height: 12,
    marginRight: 4,
    borderRadius: 2,
  },
});

export default Legend;그리고 <LineChart /> 에서 이 컴포넌트를 사용하게끔 하자.
// ...
import Legend from "./Legend";

// ...
function LineChart({
  // ...
}) {
  return (
    <>
      <Svg {/* ... */}>
        {loaded && (
          <LineChartBody {/* ... */} />
        )}
      </Svg>
      <Legend series={series} linesOptions={linesOptions} />    </>
  );
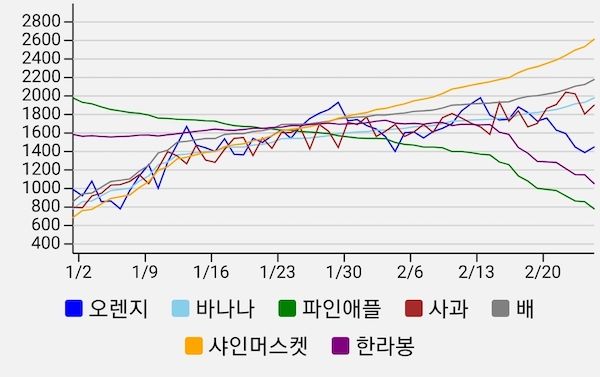
}그러면 아래처럼 레전드가 표시되는 걸 확인할 수 있다.
2.2. 특정 시리즈 활성화/비활성화
일반적인 차트에서, 레전드에서 특정 시리즈를 누르면 해당 시리즈가 비활성화되면서 차트에서도 보이지 않게 되는 것을 볼 수 있다.
해당 기능을 구현해보자.
2.2.1. <Legend /> 에 press 이벤트 처리
레전드의 각 아이템이 press 이벤트를 각각 처리할 수 있도록 수정해줘야 한다.
먼저 <Legend /> 에 onPressItem prop 을 추가하고 레전드 아이템의 컨테이너를 <View /> 에서 <Pressable /> 로 바꾸자.
import { StyleSheet, View, Pressable } from "react-native";

type LegendProps = {
  series: TimeSeries[];
  linesOptions?: LinesOptions;
  onPressItem?: (sr: TimeSeries, idx: number) => void;};
function Legend({
  series,
  linesOptions,
  onPressItem,}: LegendProps) {
  const colors = linesOptions?.colors ?? DEFAULT_COLORS;
  return (
    <View style={styles.container}>
      {series.map((sr, i) => (
        <Pressable          key={i}          style={styles.item}          onPress={() => onPressItem?.(sr, i)}        >          <View
            style={{
              ...styles.rect,
              backgroundColor: sr.color ?? colors[i % colors.length],
            }}
          />
          <Text>{sr.name ?? `시리즈 ${i + 1}`}</Text>
        </Pressable>      ))}
    </View>
  );
}

// ...

export default Legend;이제 레전드의 아이템이 눌렸을 때 onPressItem 이 실행될 것이다.
2.2.2. TimeSeries 에 visible 필드 추가
각 시리즈의 활성화/비활성화 상태가 바뀔 수 있게 되었으므로, <LineChart /> 에서도 series 를 state 로 관리하는 게 좋겠다.
TimeSeries 타입에 visible 필드를 추가하고, 레전드에서 특정 시리즈를 누를 때마다 해당 값이 바뀌도록 <LineChart /> 를 수정하자.
export type TimeSeries = {
  name?: string;
  color?: string;
  lineWidth?: number;
  visible?: boolean;  data: TimeSeriesDatum[];
};// ...
function LineChart({
// ...
series,
}: LineChartProps) {
const [state, setState] = useImmer({
// ...
series: [] as TimeSeries[], });
// `series` prop 값이 바뀔 때마다 바로 `state.series` 에 해당 값을 파싱해 넣어준다. useEffect(() => { setState((dr) => { dr.series = series.map((sr) => ({ ...sr, visible: sr.visible ?? true, })); }); }, [series]);
// `<Legend />` 에서 특정 시리즈가 눌릴 때마다, 해당 시리즈의 `visible` 필드를 토글해준다. const onPressLegendItem = (sr: TimeSeries, idx: number) => { setState((dr) => { dr.series = dr.series.map((sr, i) => i !== idx ? sr : { ...sr, visible: !sr.visible } ); }); };
// ...
return (
<>
<Svg {/* ... */}>
{loaded && (
<LineChartBody {/* ... */}
/>
)}
</Svg>
<Legend
series={state.series}
linesOptions={linesOptions}
onPressItem={onPressLegendItem} />
</>
);
}
export default LineChart;2.2.3. 비활성화된 시리즈는 차트에서 보이지 않도록 수정
비활성화된 시리즈는 차트의 라인을 그릴 때도 당연히 제외되어야 한다. 관련해서 수정되어야 하는 코드는 getLinearScale(), getTimeScale(), <Lines /> 가 있다. 차례대로 고쳐보자.
// ...

function getLinearScale(series: TimeSeries[], range: [number, number]) {
  // `visible` 이 `true` 인 것만 scale 함수 생성에 사용한다.  const visibles = series.filter((sr) => sr.visible);
  // 값이 있는지 없는지 검증도 `visibles` 로 한다.  if (!visibles?.length) {    return null;  }  if (range[0] === 0 && range[1] === 0) {
    return null;
  }

  // scale 함수를 만들기 위한 데이터도 `visibles` 로 만든다.  const allData = visibles.reduce(    (acc, sr) => [...acc, ...sr.data],    [] as TimeSeries["data"]  );
  // ...
}

export default getLinearScale;// ...
function getTimeScale(series: TimeSeries[], range: [number, number]) {
// `visible` 이 true 인 것만 scale 함수 생성에 사용한다. const visibles = series.filter((sr) => sr.visible);
// 값이 있는지 없는지 검증도 `visibles` 로 한다. if (!visibles?.length) { return null; } if (range[0] === 0 && range[1] === 0) {
return null;
}
// scale 함수를 만들기 위한 데이터도 `visibles` 로 만든다. const allData = visibles.reduce( (acc, sr) => [...acc, ...sr.data], [] as TimeSeries["data"] );
// ...
}
export default getTimeScale;// ...
function Lines({
// ...
}) {
return (
<G>
{series.map((sr, i) =>
// `sr.visible` 이 `false` 면 `null` 을 렌더링한다. // `sr.visible` 이 `true` 면 `<Path />` 를 렌더링한다. !sr.visible ? null : <Path {/* ... */} /> )}
</G>
);
}
export default Lines;마지막으로 <Legend />로 돌아가서, 비활성화된 시리즈 아이템은 색상을 회색으로 바꿔주자.
//...

function Legend({ series, linesOptions, onPressItem }: LegendProps) {
  const colors = linesOptions?.colors ?? DEFAULT_COLORS;
  return (
    <View style={styles.container}>
      {series.map((sr, i) => (
        <Pressable
          key={i}
          style={styles.item}
          onPress={() => onPressItem?.(sr, i)}
        >
          <View
            style={{
              ...styles.rect,
              backgroundColor: !sr.visible                ? "lightgray"                : sr.color ?? colors[i % colors.length],            }}
          />
          <Text style={!sr.visible ? { color: "lightgray" } : {}}>            {sr.name ?? `시리즈 ${i + 1}`}
          </Text>
        </Pressable>
      ))}
    </View>
  );
}

// ...

export default Legend;이제 레전드에서 특정 시리즈를 누르면 비활성화되는 것을 확인할 수 있다.
2.3. LegendOptions
레전드도 구현하다보니 옵션이 있으면 좋을 것 같다. 아이템별 네모의 크기, 스타일, 폰트 크기 등의 스타일은 물론이고 레전드 자체의 위치나 아이템 나열 방향 등등을 컴포넌트 사용자가 컨트롤하기 위해서 말이다.
2.3.1. 옵션 타입 추가
일단 옵션의 타입부터 추가하자.
export type LegendOptions = {
  enabled?: boolean;

  // 레전드의 위치
  position?: "bottom" | "top" | "left" | "right";
  // 레전드 내 아이템들의 나열 방향
  // position 이 'left'/'right' 일 때는 'column' 으로 고정된다
  direction?: "row" | "column";
  // 레전드 아이템들 정렬 방향
  align?: "center" | "flex-start" | "flex-end";

  // 레전드 아이템의 여백
  itemPadding?: number;
  itemPaddingTop?: number;
  itemPaddingLeft?: number;
  itemPaddingRight?: number;
  itemPaddingBottom?: number;

  // 레전드 아이템 내에 네모와 라벨 간 간격
  itemGap?: number;
  // 레전드 아이템이 비활성화 되었을 때 표시될 색상
  itemNotVisibleColor?: string;

  // 레전드 아이템 네모의 너비
  itemRectWidth?: number;
  // 레전드 아이템 네모의 높이
  itemRectHeight?: number;
  // 레전드 아이템 네모의 둥근 모서리 반지름
  itemRectBorderRadius?: number;

  // 레전드 아이템 라벨의 폰트 크기
  itemLabelSize?: number;
  // 레전드 아이템 라벨의 폰트
  itemLabelFont?: string;
  // 레전드 아이템 라벨의 폰트 굵기
  itemLabelWeight?: "100" | "200" | "300" | "400" | "500" | "600" | "700" | "800" | "900";
  // 레전드 아이템 라벨의 폰트 색상
  itemLabelColor?: string;
  // 레전드 아이템 라벨의 형식
  itemLabelFormatter?: (series: TimeSeries, idx: number) => string;
};2.3.2. <LineChart />로부터 옵션 전달
그리고 차트의 다른 옵션들을 구현했을 때처럼 <LineChart /> 가 해당 옵션을 prop 으로 받을 수 있게끔 하고, <LineChart /> 는 <Legend /> 에게 해당 옵션값을 전달해주도록 하자.
// ...

type LineChartProps = {
  // ...
  legendOptions?: LegendOptions}
function LineChart({
  // ...
  legendOptions,}: LineChartProps) {

  return (
    <>
      <Svg {/* ... */}>
        {loaded && (
          <LineChartBody {/* ... */}
          />
        )}
      </Svg>
      <Legend
        series={state.series}
        linesOptions={linesOptions}
        onPressItem={onPressLegendItem}
        {...legendOptions}      />
    </>
  );
}

export default LineChart;2.3.3. legendOptions.position
다른 옵션은 모두 <Legend /> 에서 처리할 수 있지만 레전드의 위치 (position) 처리만큼은 <LineChart /> 에서도 같이 처리해주어야 한다. < /> 로 감싸고 있던 것을 <View /> 로 감싸도록 수정한 뒤 옵션을 적용하자.
// ...

type LineChartProps = {
  // ...
  legendOptions?: LegendOptions
}
function LineChart({
  // ...
  paneOptions,
  legendOptions,
}: LineChartProps) {
  // ...

  useEffect(() => {
    updatePaneBoundary();
  }, [
    paneOptions?.margin,
    paneOptions?.marginTop,
    paneOptions?.marginLeft,
    paneOptions?.marginRight,
    paneOptions?.marginBottom,
    // 레전드가 왼쪽/오른쪽에 위치하면 차트의 영역이 줄어들기 때문에    // 레전드의 위치가 바뀔 때마다 `paneBoundary` 를 다시 계산해줘야 한다.    legendOptions?.enabled,    legendOptions?.position,  ]);

  return (
    <View
      style={{
        // 레전드의 위치는 `flexDirection` 으로 컨트롤한다.        flexDirection:          legendOptions?.position === 'top'            ? 'column-reverse'            : legendOptions?.position === 'right'            ? 'row'            : legendOptions?.position === 'left'            ? 'row-reverse'            : 'column',        // - `width` prop 은 이제 `<Svg />` 가 쓰지 않고 이 컴포넌트에서 사용한다.        // - `<Svg />` 의 `width` 너비는 `100%` 로 고정하고        //  `<Svg />` 의 래핑 엘리먼트를 `{flex: 1}` 로 지정해 놓으면        //  레전드가 왼쪽/오른쪽에 위치할 때 너비 계산이 편하다.        width: width,      }}
    >
      <View style={{ flex: 1 }}>        <Svg width="100%" height={height} onLayout={onLayout}>          {loaded && (
            <LineChartBody
              {/* ... */}
            />
          )}
        </Svg>
      </View>
      <Legend {/* ... */}/>
    </View>
  );
}

export default LineChart;2.3.4. <Legend /> 수정
옵션을 전달했으니, <Legend /> 에서 해당 옵션을 사용하도록 구현을 수정해보자.
// ...
import getContainerStyle from "./getContainerStyle";

const NOT_VISIBLE_COLOR = "gainsboro";

// `LegendOptions` 타입의 속성을 모두 prop 으로 받을 수 있도록 지정해주자.
type LegendProps = LegendOptions & {
  // ...
};
function Legend({
  series,
  linesOptions,
  onPressItem,

  enabled = true,

  position,
  direction = "row",
  align = "center",

  itemGap = 4,
  itemNotVisibleColor = NOT_VISIBLE_COLOR,

  itemPadding,
  itemPaddingTop,
  itemPaddingLeft,
  itemPaddingRight,
  itemPaddingBottom,

  itemRectWidth = 12,
  itemRectHeight = 12,
  itemRectBorderRadius = 2,

  itemLabelSize,
  itemLabelFont,
  itemLabelWeight,
  itemLabelColor,
  itemLabelFormatter,
}: LegendProps) {
  const colors = linesOptions?.colors ?? DEFAULT_COLORS;

  if (!enabled) {
    return null;
  }
  return (
    <View
      style={getContainerStyle({ position, direction, align, width, height })}
    >
      {series.map((sr, i) => (
        <Pressable
          key={i}
          style={[
            styles.item,
            {
              paddingTop: itemPaddingTop ?? itemPadding ?? 2,
              paddingLeft: itemPaddingLeft ?? itemPadding ?? 8,
              paddingRight: itemPaddingRight ?? itemPadding ?? 8,
              paddingBottom: itemPaddingBottom ?? itemPadding ?? 2,
            },
          ]}
          onPress={() => onPressItem?.(sr, i)}
        >
          <View
            style={{
              width: itemRectWidth,
              height: itemRectHeight,
              marginRight: itemGap,
              borderRadius: itemRectBorderRadius,
              backgroundColor: !sr.visible
                ? itemNotVisibleColor
                : sr.color ?? colors[i % colors.length],
            }}
          />
          <Text
            style={{
              fontSize: itemLabelSize,
              fontFamily: itemLabelFont,
              fontWeight: itemLabelWeight,
              ...(!sr.visible
                ? { color: itemNotVisibleColor }
                : itemLabelColor
                ? { color: itemLabelColor }
                : {}),
            }}
          >
            {itemLabelFormatter?.(sr, i) ?? sr.name ?? `시리즈 ${i + 1}`}
          </Text>
        </Pressable>
      ))}
    </View>
  );
}

const styles = StyleSheet.create({
  // ...
});

export default Legend;47 라인의 getContainerStyle() 함수는 아래와 같다.
const getContainerStyle = ({
  position,
  direction,
  align,
  width,
  height,
}: LegendOptions): ViewProps["style"] => {
  if (position === "right" || position === "left") {
    return {
      flexDirection: "column",
      justifyContent: "center",
      alignItems: align ?? "flex-start",
      width,
    };
  }

  if (direction === "column") {
    return {
      flexDirection: "column",
      justifyContent: height ? "flex-start" : "center",
      alignItems: align ?? "center",
      flexWrap: height ? "wrap" : undefined,
      width: width ?? "100%",
      height,
    };
  }

  return {
    flexDirection: "row",
    justifyContent: align ?? "center",
    alignItems: "center",
    flexWrap: "wrap",
    width: width ?? "100%",
    height,
  };
};

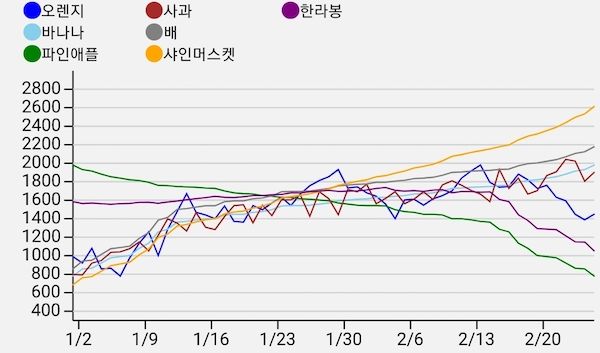
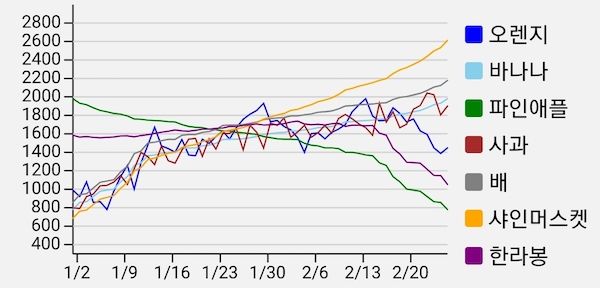
export default getContainerStyle;이제 하드코딩은 모두 없어졌고, 옵션 값을 사용해 레전드를 컨트롤할 수 있게 되었다.
<LineChart
  series={dummySeries}
  width="100%"
  height={200}
  legendOptions={{
    position: "top",
    direction: "column",
    align: "flex-start",
    height: 45,
    itemPadding: 0,
    itemPaddingLeft: 16,
    itemPaddingRight: 16,
    itemLabelSize: 10,
    itemGap: 0,
    itemNotVisibleColor: "darkgray",
    itemRectBorderRadius: 20,
  }}
/>
<LineChart
  series={dummySeries}
  width="100%"
  height={200}
  legendOptions={{
    position: "right",
  }}
/>
<LineChart
  series={dummySeries}
  width="100%"
  height={200}
  legendOptions={{
    position: "left",
    itemRectHeight: 2,
    itemLabelSize: 10,
    align: "flex-start",
  }}
/>3. 결과
이제 차트에서 레전드를 사용할 수 있게 되었다.
3.1. 이슈
레전드 기능이 잘 동작하지만 이슈가 몇 개 남아있다.
<LineChart />의width는 (레전드가 옆에 있을 경우) 차트와 레전드 너비의 합이지만,height는 (레전드가 위아래에 있다고 해도) 레전드의 높이가 포함되지 않은 차트만의 높이 값이 된다. prop 의 이름을 변경하던 구현을 변경하던 수정이 필요하다.- 시리즈를 활성화/비활성화하면서 라인이 나타나고 사라질 때가 너무 딱딱하다. 애니메이션이 있으면 좋을 것 같다.
이 이슈들은 후속글들에서 개선할 예정이다.
3.2. 상세 코드 전문
본문에 삽입된 코드들은 생략된 부분들이 있으므로 코드 전문을 보고 싶다면 아래 링크를 참고하자.
3.3. 실행해보기
구현 결과를 실기기 혹은 에뮬레이터에서 직접 확인하고 싶다면 https://github.com/ricale/D3ChartExamples 에서 프로젝트를 받아서 실행해보면 된다.
# 안드로이드
git clone https://github.com/ricale/D3ChartExamples.git
cd ./D3ChartExamples
yarn
yarn android# iOS
git clone https://github.com/ricale/D3ChartExamples.git
cd ./D3ChartExamples
yarn
cd ./ios && pod install && cd ../
yarn ios4. 다음
다음에 구현 및 정리할 예정인 작업들은 아래와 같다.
- 라인차트 특정 아이템 선택 기능 구현 (터치 이벤트 활용)
- 라인차트 애니메이션 기능 구현 (초기화 시, 값 변경 시 등)
- 컬럼차트 구현 (상세 계획 미정)
- 파이차트 구현 (상세 계획 미정)
