React Native 에서 차트 구현 - 1. 라인차트 기본 기능
1. 시리즈 "React Native 에서 차트 구현" 개요
React Native 는 React 기반의 앱 개발 프레임워크지만, React 환경에서 쓰이는 차트 라이브러리들(D3.js, HighCharts.js 등등)을 그대로 사용할 수는 �없다. 왜냐하면 대부분의 차트 라이브러리들은 웹의 SVG 기반으로 이루어져 있는데, React Native 의 SVG 구현체인 react-native-svg 는 웹 SVG 의 인터페이스를 모방했을 뿐 내부적으로는 전혀 다르게 구현되어 있기 때문이다.
하지만 React 와 React Native 가 내세우는 슬로건이 무엇인가. "Learn once, write anywhere" 가 아닌가.
웹에서 차트를 구현했던 경험들을 잊거나 쓸모없게 하고 싶지 않았다. 그래서 얼마 전, React Native 에서 차트를 구현해야 할 일이 생겼을 때, React Native 를 위한 다른 차트 라이브러리를 사용하는 것이 아니라 react-native-svg 와 D3.js 를 조합해서 차트를 구현하기로 결정했었다.
결과적으로 결정은 틀리지 않았고, react-native-svg 와 D3.js 를 조합해 웹과 거의 유사한 경험으로 차트를 구현할 수 있었다.
이 글 및 시리즈는 그러한 구현 경험을 공유하고자 작성하는 글이다. 실무에서의 기억을 더듬어가며 처음부터 다시 차근차근 구현하면서, 그 구현을 토대로 글을 작성해나갈 생각이다.
2. 이 글의 개요
시리즈의 시작으로, 가장 간단한 차트 중 하나인 라인 차트를 구현해보겠다. 이 글에서는 복잡한 기능은 전혀 구현하지 않을 것이다. 데이터를 넣으면 차트가 그려진다. 그게 끝이다. 상세한 옵션 설정도, 애니메이션 기능도 없다.
모든 부가적인 기능은 다음 글들로 미뤄두고, 여기에서는 react-native-svg 와 D3.js 를 사용해서 차트 기능을 구현하는 것에 초점을 맞춘다.
3. 구현
3.1. 프로젝트 초기화 및 디펜던시 설치
일단 처음이니 프로젝트 초기화부터 해보자. 아래 명령어로 React Native 프로젝트를 만들자.
npx react-native@latest init D3ChartExamples
cd ./D3ChartExamples예제들을 여러 화면으로 나눠서 적용할 것이기 때문에 라우팅 라이브러리도 필요하다. 이건 react-navigation 을 사용하자.
yarn add @react-navigation/native @react-navigation/native-stack react-native-safe-area-context react-native-screens(이 글에서는 react-navigation 에 대해 다루지 않는다. 필요하다면 공식 문서를 참고하자.)
상태 관리를 편하게 하기 위해 use-immer 를 설치하자.
yarn add immer use-immer(전역 상태까지는 필요 없기 때문에 Redux, Recoil 등은 사용하지 않는다.)
마지막으로 이 글 및 시리즈를 위한 핵심 라이브러리인 react-native-svg 와 D3.js 를 설치하자.
yarn add react-native-svg d3
yarn add --dev @types/d3이제 준비는 끝났다.
3.2. <LineChart /> 컴포넌트 작성, D3.js 관련 초기화
라인 차트 기능을 수행할 <LineChart /> 컴포넌트를 작성해보자. props 의 타입은 아래와 같다.
type LineChartProps = {
  series: TimeSeries[];
  width?: string | number;
  height?: string | number;
};series: 차트에 쓰일 데이터의 배열이다.TimeSeries타입은 아래와 같다.당장은 멤버가type TimeSeries = { data: { date: Date; value: number }[]; };data밖에 없지만 나중에 다른 기능들을 구현하면서 계속 늘어날 예정이다.width,height: 차트의 크기.string타입도 받는 이유는'100%'같은 값도 받아야 하기 때문이다.
이 prop 들을 가지고 차트 컴포넌트를 간략하게 작성해보면 아래와 같다.
import { Svg } from "react-native-svg";
import LineChartBody from "./LineChartBody";

function LineChart({ series, width = "100%", height = 200 }: LineChartProps) {
  const allData = series.reduce(
    (acc, sr) => [...acc, ...sr.data],
    [] as TimeSeriesDatum[]
  );

  // D3.js 로 x 축 값을 계산할 함수를 만든다.
  const xScale = d3
    .scaleTime()
    .domain(d3.extent(allData, (dt) => dt.date) as [Date, Date])
    .range(/* ... */);

  // D3.js 로 y 축 값을 계산할 함수를 만든다.
  const yScale = d3
    .scaleLinear()
    .domain(d3.extent(allData, (dt) => dt.value) as [number, number])
    .range(/* ... */);

  // D3.js 로 라인차트의 라인을 그릴 함수를 만든다.
  const lineFunc = d3
    .line<TimeSeriesDatum>()
    .defined((dt) => !isNaN(dt.value))
    .x((dt) => xScale(dt.date))
    .y((dt) => yScale(dt.value));

  return (
    <Svg width={width} height={height}>
      <LineChartBody
        xScale={xScale}
        yScale={yScale}
        lineFunc={lineFunc}
        series={series}
      />
    </Svg>
  );
}이 코드에는 (<LineChartBody /> 를 아직 구현하지 않았다는 것 이외에도) 문제가 있다. 바로 14라인과 20라인에, .range() 함수의 인자로 차트를 그릴 범위를 픽셀 단위로 입력해주어야 한다는 것이다.
하지만 우리는 컨테이너인 30라인의 <Svg /> 컴포넌트의 크기를 알 수 없으므로, 차트를 그릴 범위도 알 수 없다. width, height 로 너비와 높이를 직접 지정해주고 있지만 "100%" 같은 문자열 값을 사용할 수도 있으므로 해당 값들만으로는 정확한 너비와 높이를 알 수 없다.
그렇다면 너비와 높이는 어떻게 알 수 있을까? 해결 방법은 <Svg /> 에 onLayout 콜백을 추가해주는 것이다. 해당 콜백은 컴포넌트의 렌더링이 끝났을 때 실행되며, 컴포넌트의 크기를 알려준다.
3.2.1. onLayout 콜백
// ...
import PaneBoundary from "../../../../utils/PaneBoundary";

const X_AXIS_HEIGHT = 25;
const Y_AXIS_WIDTH = 40;

function LineChart({ series, width = "100%", height = 200 }: LineChartProps) {
  // `onLayout` 콜백으로부터 받아온 값들을 저장하기 위한 state  const [state, setState] = useImmer({    // 차트의 너비    width: 0,    // 차트의 높이    height: 0,    // 차트를 그릴 영역    paneBoundary: { x1: 0, x2: 0, y1: 0, y2: 0 },  });
  const onLayout: SvgProps["onLayout"] = (evt) => {    const { layout } = evt.nativeEvent;    setState((dr) => {      // 이벤트 리스너가 준 너비/높이에서 쓸데 없는 소수점은 버리고 사용      dr.width = Math.round(layout.width);      dr.height = Math.round(layout.height);      // 여백들을 당장은 모두 10 으로 하드코딩하지만      // 나중에 옵션으로 받을 수 있게끔 할 예정      const marginTop = 10;      const marginLeft = 10;      const marginRight = 10;      const marginBottom = 10;      // 아래 네 좌표(x1, x2, y1, y2)가 차트의 본체가 그려질 영역의 좌표다.      // X축, Y축 등은 이 영역 밖에 그려진다.      dr.paneBoundary = {        x1: marginLeft + Y_AXIS_WIDTH,        x2: dr.width - marginRight,        y1: dr.height - marginBottom - X_AXIS_HEIGHT,        y2: marginTop,      };    });  };
  const allData = series.reduce(/* ... */);

  // D3.js 로 x 축 값을 계산할 함수를 만든다.
  const xScale = d3
    .scaleTime()
    .domain(d3.extent(allData, (dt) => dt.date) as [Date, Date])
    .range([state.paneBoundary.x1, state.paneBoundary.x2]);
  // D3.js 로 y 축 값을 계산할 함수를 만든다.
  const yScale = d3
    .scaleLinear()
    .domain(d3.extent(allData, (dt) => dt.value) as [number, number])
    .range([state.paneBoundary.y1, state.paneBoundary.y2]);
  const lineFunc = d3
    .line<TimeSeriesDatum>()
    .defined((dt) => !isNaN(dt.value))
    .x((dt) => xScale(dt.date))
    .y((dt) => yScale(dt.value));

  return (
    <Svg width={width} height={height} onLayout={onLayout}>
      <LineChartBody
        xScale={xScale}
        yScale={yScale}
        lineFunc={lineFunc}
        series={series}
      />
    </Svg>
  );
}onLayout 콜백에서 <Svg /> 의 크기를 가져와서, 차트가 그려질 범위를 계산한 뒤 state 에 집어넣었다.
onLayout 으로부터 <Svg /> 의 크기를 받아오기 전에는 차트를 미리 그릴 수 없으므로, 관련된 처리도 해주자.
// ...

function LineChart({ series, width = "100%", height = 200 }: LineChartProps) {
  // ...

  const allData = series.reduce(/* ... */);

  const xScale =
    !series?.length ||    (state.paneBoundary.x1 === 0 && state.paneBoundary.x2 === 0)      ? null      : d3
          .scaleTime()
          .domain(d3.extent(allData, (dt) => dt.date) as [Date, Date])
          .range([state.paneBoundary.x1, state.paneBoundary.x2]);

  const yScale =
    !series?.length ||    (state.paneBoundary.y1 === 0 && state.paneBoundary.y2 === 0)      ? null      : d3
          .scaleLinear()
          .domain(d3.extent(allData, (dt) => dt.value) as [number, number])
          .range([state.paneBoundary.y1, state.paneBoundary.y2]);

  const lineFunc =
    !xScale || !yScale      ? null      : d3
          .line<TimeSeriesDatum>()
          .defined((dt) => !isNaN(dt.value))
          .x((dt) => xScale(dt.date))
          .y((dt) => yScale(dt.value));

  // `xScale`, `yScale`, `lineFunc` 가 모두 초기화되었는지 확인  // 해당 함수들은 차트의 너비/높이를 알기 전에는 초기화되지 않는다.  const loaded = xScale !== null && yScale !== null && lineFunc !== null;
  return (
    <Svg width={width} height={height} onLayout={onLayout}>
      {loaded && (        <LineChartBody
          xScale={xScale}
          yScale={yScale}
          lineFunc={lineFunc}
          series={series}
        />
      )}
    </Svg>
  );
}3.2.2. getTimeScale(), getLinearScale()
작성하고보니 xScale, yScale 초기화 코드가 너무 지저분하다. 추후 확장성까지 고려해서 둘 다 별개의 함수로 분리하자.
// ...
import getTimeScale from "./getTimeScale";
import getLinearScale from "./getLinearScale";

function LineChart({ series, width = "100%", height = 200 }: LineChartProps) {
  // ...

  const xScale = getTimeScale(series, [
    state.paneBoundary.x1,
    state.paneBoundary.x2,
  ]);

  const yScale = getLinearScale(series, [
    state.paneBoundary.y1,
    state.paneBoundary.y2,
  ]);

  // ...
}import * as d3 from "d3";
import { TimeSeries } from "./types";
// 이름의 `TimeScale` 에서 알 수 있듯이 이 함수는 시계열 데이터에 대해 다룬다.
// 현재 우리가 구현하고 있는 라인차트의 X 축이 시계열 데이터를 다룬다.
function getTimeScale(
series: TimeSeries[] | undefined,
range: [number, number]
) {
if (!series?.length) {
return null;
}
if (range[0] === 0 && range[1] === 0) {
return null;
}
const allData = series.reduce(
(acc, sr) => [...acc, ...sr.data],
[] as TimeSeries["data"]
);
const domain = d3.extent(allData, (dt) => dt.date) as [Date, Date];
const scale = d3.scaleTime().domain(domain).range(range);
return scale;
}
export default getTimeScale;import * as d3 from "d3";
import { TimeSeries, TimeSeriesDatum } from "./types";
// 이름의 `LinearScale` 에서 알 수 있듯이 이 함수는 선형적인 숫자 데이터를 다룬다.
// 현재 우리가 구현하고 있는 라인차트의 Y 축이 선형적인 숫자 데이터를 다룬다.
function getLinearScale(series: TimeSeries[], range: [number, number]) {
if (!series?.length) {
return null;
}
if (range[0] === 0 && range[1] === 0) {
return null;
}
const allData = series.reduce(
(acc, sr) => [...acc, ...sr.data],
[] as TimeSeriesDatum[]
);
if (!allData.length) {
return null;
}
const domain = d3.extent(allData, (dt) => dt.value) as [number, number];
// 최소값/최대값 범위로만 차트를 구현하면 너무 여백 없이 딱 붙어 나오므로
// 여백을 위한 오차를 계산해 추가한다.
const offsetDelta = 0.2;
const offset = (domain[1] - domain[0]) * offsetDelta;
domain[0] -= offset;
domain[1] += offset;
const scale = d3.scaleLinear().domain(domain).range(range);
return scale;
}
export default getLinearScale;3.3. <LineChartBody /> 작성
이제 <LineChart /> 에서 D3.js 로 만든 함수들 (xScale(), yScale(), lineFunc()) 을 가지고 차트의 몸체인 <LineChartBody /> 를 구현해보자.
<LineChartBody /> 코드 자체는 짧다.
// ...
import XAxis from "./XAxis";
import YAxis from "./YAxis";
import Grid from "./Grid";
import Lines from "./Lines";

function LineChartBody({
  series,
  xScale,
  yScale,
  lineFunc,
  paneBoundary,
}: LineChartBodyProps) {
  return (
    <Fragment>
      <XAxis
        scale={xScale}
        y={paneBoundary.y1}
        x1={paneBoundary.x1}
        x2={paneBoundary.x2}
      />
      <YAxis scale={yScale} x={paneBoundary.x1} y={0} />
      <Grid yScale={yScale} x1={paneBoundary.x1} x2={paneBoundary.x2} />
      <Lines series={series} lineFunc={lineFunc} />
    </Fragment>
  );
}

export default LineChartBody;이런 식으로 기능별로 컴포넌트가 나눠질 것이고, <LineChartBody /> 는 컨테이너 역할만 한다.
기능별로 컴포넌트를 나눈 이유는 가독성과 확장성, 재사용성을 위해서다.
그럼 하나씩 차근차근 구현해보자.
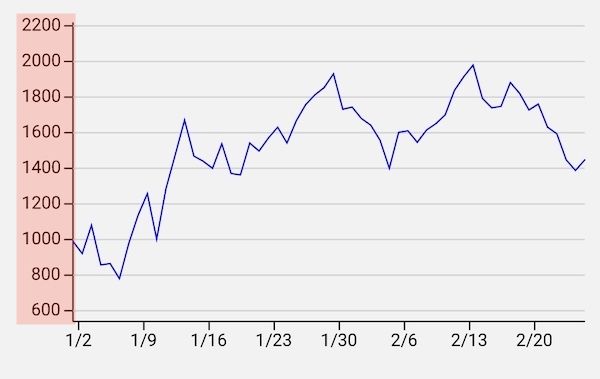
3.3.1. <YAxis />
import { G, Line, Text } from "react-native-svg";

const TICK_WIDTH = 6;

type YAxisProps = {
  // 이름은 `scale` 이지만, `<LineChart />` 에서 만들어진 `yScale` 을 받는다.
  scale: d3.ScaleLinear<number, number, never>;
  // `x` 값 만큼 Y 축 세로선이 우측으로 이동한다.
  x: number;
  // `y` 값 만큼 Y 축 세로선이 아래로 이동한다.
  y: number;
};
function YAxis({ scale, x, y }: YAxisProps) {
  const range = scale.range();
  const ticks = scale.ticks();

  // 선의 색상/스타일, 라벨의 형식/색상/스타일 등이 하드코딩 되어있다.
  // 다음 글에서는 이 값들을 지정할 수 있게끔 수정할 것이다.
  return (
    <G>
      <Line
        x1={x}
        x2={x}
        y1={range[0] + y}
        y2={range[1] + y}
        stroke="black"
        strokeWidth={1}
      />
      {ticks.map((tick) => (
        <Line
          key={`${tick}`}
          x1={x - TICK_WIDTH}
          x2={x}
          y1={scale(tick)}
          y2={scale(tick)}
          stroke="black"
          strokeWidth={1}
        />
      ))}
      {ticks.map((tick) => (
        <Text
          key={`${tick}`}
          x={x - TICK_WIDTH - 2}
          y={scale(tick)}
          fill="black"
          textAnchor="end"
          alignmentBaseline="middle"
        >
          {`${tick}`}
        </Text>
      ))}
    </G>
  );
}

export default YAxis;웹에서 SVG 를 다뤄봤다면 익숙한 코드일 것이다. react-native-svg 가 웹의 SVG 인터페이스를 그대로 가져왔기 때문이다.
하지만 SVG 를 직접 쓰지 않고 D3.js 만 익숙한 사람에게는 생경할 수 있다. 왜냐면 D3.js 는 DOM 엘리먼트들을 굳이 직접 작성하지 않고 D3.js 에서 제공하는 API 만 사용해도 차트를 렌더링을 할 수 있기 때문이다.
D3.js 는 어디까지나 DOM 을 다루는 라이브러리고, react-native-svg 까지 다루지는 못한다. 따라서 D3.js 로 차트를 그리는데 필요한 연산만 하고, 실제로 렌더링은 react-native-svg 를 사용해 직접 해야 한다.
위 코드에서는 연산을 위한 함수(scale)를 <LineChart /> 로부터 전달받았으니, 그 함수를 사용해 SVG 컴포넌트들을 렌더링하고 있는 것이다.
<YAxis /> 뿐만 아니라 다른 컴포넌트들도 모두 같은 방식으로 구현한다.
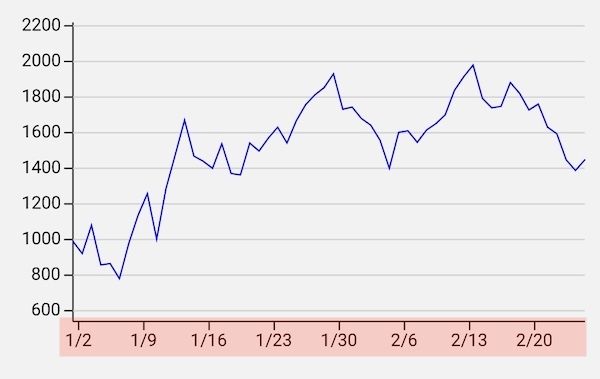
3.3.2. <XAxis />
import * as d3 from "d3";
import { G, Line, Text } from "react-native-svg";
import dateFormat from "../../../../../utils/dateFormat";

const TICK_HEIGHT = 6;

type XAxisProps = {
  // 이름은 `scale` 이지만, `<LineChart />` 에서 만들어진 `xScale` 을 받는다.
  scale: d3.ScaleTime<number, number, never>;
  // `x` 값 만큼 X 축 세로선이 우측으로 이동한다.
  x?: number;
  // `y` 값 만큼 Y 축 세로선이 우측으로 이동한다.
  y?: number;
};
function XAxis({ scale, x = 0, y = 0 }: XAxisProps) {
  const range = scale.range();
  const ticks = scale.ticks();

  // 선의 색상/스타일, 라벨의 형식/색상/스타일 등이 하드코딩 되어있다.
  // 다음 글에서는 이 값들을 지정할 수 있게끔 수정할 것이다.
  return (
    <G>
      <Line
        x1={range[0] + x}
        x2={range[1] + x}
        y1={y}
        y2={y}
        stroke="black"
        strokeWidth={1}
      />
      {ticks.map((tick) => (
        <Line
          key={`${tick}`}
          x1={scale(tick)}
          x2={scale(tick)}
          y1={y}
          y2={y + TICK_HEIGHT}
          stroke="black"
        />
      ))}
      {ticks.map((tick) => (
        <Text
          key={`${tick}`}
          x={scale(tick)}
          y={y + TICK_HEIGHT + 2}
          fill="black"
          textAnchor="middle"
          alignmentBaseline="hanging"
        >
          {`${dateFormat(tick)}`}
        </Text>
      ))}
    </G>
  );
}

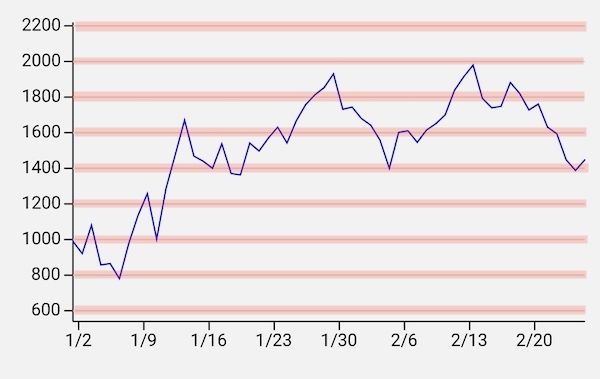
export default XAxis;3.3.3. <Grid />
import { G, Line } from "react-native-svg";

type GridProps = {
  yScale: d3.ScaleLinear<number, number, never>;
  x1: number;
  x2: number;
};
function Grid({ yScale, x1, x2 }: GridProps) {
  const ticks = yScale.ticks();

  // 현재는 수평선만 그리고 있지만 수직선도 그릴 수 있게끔,
  // 색상이나 굵기도 조정할 수 있게끔 추후 수정할 예정이다.
  return (
    <G>
      {ticks.map((tick) => (
        <Line
          key={`${tick}`}
          x1={x1}
          x2={x2}
          y1={yScale(tick)}
          y2={yScale(tick)}
          stroke="lightgray"
          strokeWidth={1}
        />
      ))}
    </G>
  );
}

export default Grid;3.3.4. <Lines />
import { G, Path } from "react-native-svg";
import { TimeSeries } from "../types";

type LinesProps = {
  series: TimeSeries[];
  lineFunc: d3.Line<TimeSeries['data'][0]>;
};
function Lines({ series, lineFunc }: LinesProps) {
  // 현재는 파란색으로 고정되어있고 굵기나 기타 스타일도 조정할 수 없지만 조정할 수 있게끔 추후 수정할 예정이다.
  // 또한 애니메이션 처리도 나중에 여기에 구현할 예정이다.
  return (
    <G>
      {series.map((sr, i) => (
        <Path
          key={i}
          d={lineFunc(sr.data) ?? undefined}
          stroke="blue"
          strokeLinecap="round"
          fill="transparent"
          strokeWidth={1}
        />
      ))}
    </G>
  );
}

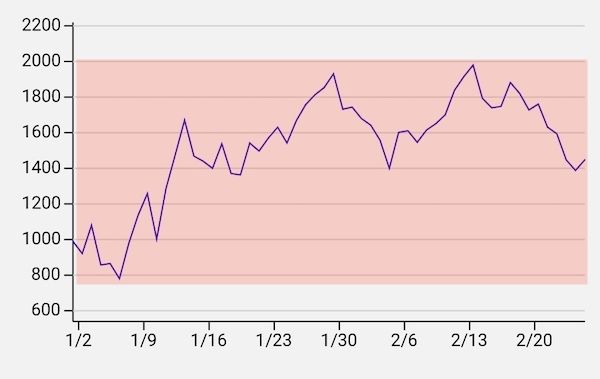
export default Lines;3.4. PaneBoundary 클래스
PaneBoundary 는 차트 내에서 차트가 렌더링되는 영역을 지정하기 위한 클래스다. 이 클래스를 작성하지 않고 객체 형식을 사용해 구현해도 되지만, 추후 확장성과 재사용성 등을 감안하면 작성해서 사용하기를 권한다.
//
// 객체로 구현할 경우
const [state, setState] = useImmer({
  // ...
  paneBoundary: { x1: 0, x2: 0, y1: 0, y2: 0 },});
const onLayout: SvgProps["onLayout"] = (evt) => {
  const { layout } = evt.nativeEvent;
  setState((dr) => {
    // ...
    dr.paneBoundary = {      x1: marginLeft + Y_AXIS_WIDTH,      x2: dr.width - marginRight,      y1: dr.height - marginBottom - X_AXIS_HEIGHT,      y2: marginTop,    };  });
};
const xScale = getTimeScale(series, [ state.paneBoundary.x1, state.paneBoundary.x2,]);const yScale = getLinearScale(series, [ state.paneBoundary.y1, state.paneBoundary.y2,]);//
// 클래스를 구현해 사용할 경우
const [state, setState] = useImmer({
// ...
paneBoundary: new PaneBoundary({ x1: 0, x2: 0, y1: 0, y2: 0 }),});
const onLayout: SvgProps["onLayout"] = (evt) => {
const { layout } = evt.nativeEvent;
setState((dr) => {
// ...
dr.paneBoundary = new PaneBoundary({ x1: marginLeft + Y_AXIS_WIDTH, x2: dr.width - marginRight, y1: dr.height - marginBottom - X_AXIS_HEIGHT, y2: marginTop, }); });
};
const xScale = getTimeScale(series, state.paneBoundary.xs);const yScale = getLinearScale(series, state.paneBoundary.ys);type PaneBoundaryOptions = {
x1: number;
x2: number;
y1: number;
y2: number;
};
class PaneBoundary {
private _x1: number;
private _x2: number;
private _y1: number;
private _y2: number;
constructor(options: PaneBoundaryOptions) {
this._x1 = options.x1;
this._x2 = options.x2;
this._y1 = options.y1;
this._y2 = options.y2;
}
get x1() {
return this._x1;
}
get x2() {
return this._x2;
}
get y1() {
return this._y1;
}
get y2() {
return this._y2;
}
get xs(): [number, number] {
return [this._x1, this._x2];
}
get ys(): [number, number] {
return [this._y1, this._y2];
}
get values() {
return {
x1: this.x1,
x2: this.x2,
y1: this.y1,
y2: this.y2,
};
}
}
export default PaneBoundary;4. 결과
이렇게 더미 데이터로 고정된 스타일의 라인차트를 그릴 수 있는 컴포넌트를 작성해보았다.
4.1. 상세 코드 전문
본문에 삽입된 코드들은 생략된 부분들이 있으므로 코드 전문을 보고 싶다면 아래 링크를 참고하자.
4.2. 실행해보기
구현 결과를 실기기 혹은 에뮬레이터에서 직접 확인하고 싶다면 https://github.com/ricale/D3ChartExamples 에서 프로젝트를 받아서 실행해보면 된다.
# 안드로이드
git clone https://github.com/ricale/D3ChartExamples.git
cd ./D3ChartExamples
yarn
yarn android# iOS
git clone https://github.com/ricale/D3ChartExamples.git
cd ./D3ChartExamples
yarn
cd ./ios && pod install && cd ../
yarn ios5. 다음
다음에 구현 및 정리할 예정인 작업들은 아래와 같다.
- 라인차트 옵션 기능 구현 (색상, 폰트, 포멧 등)
- 라인차트 애니메이션 기능 구현 (초기화 시, 값 변경 시 등)
- 컬럼차트 구현 (상세 계획 미정)
- 파이차트 구현 (상세 계획 미정)


